 View image at full size01
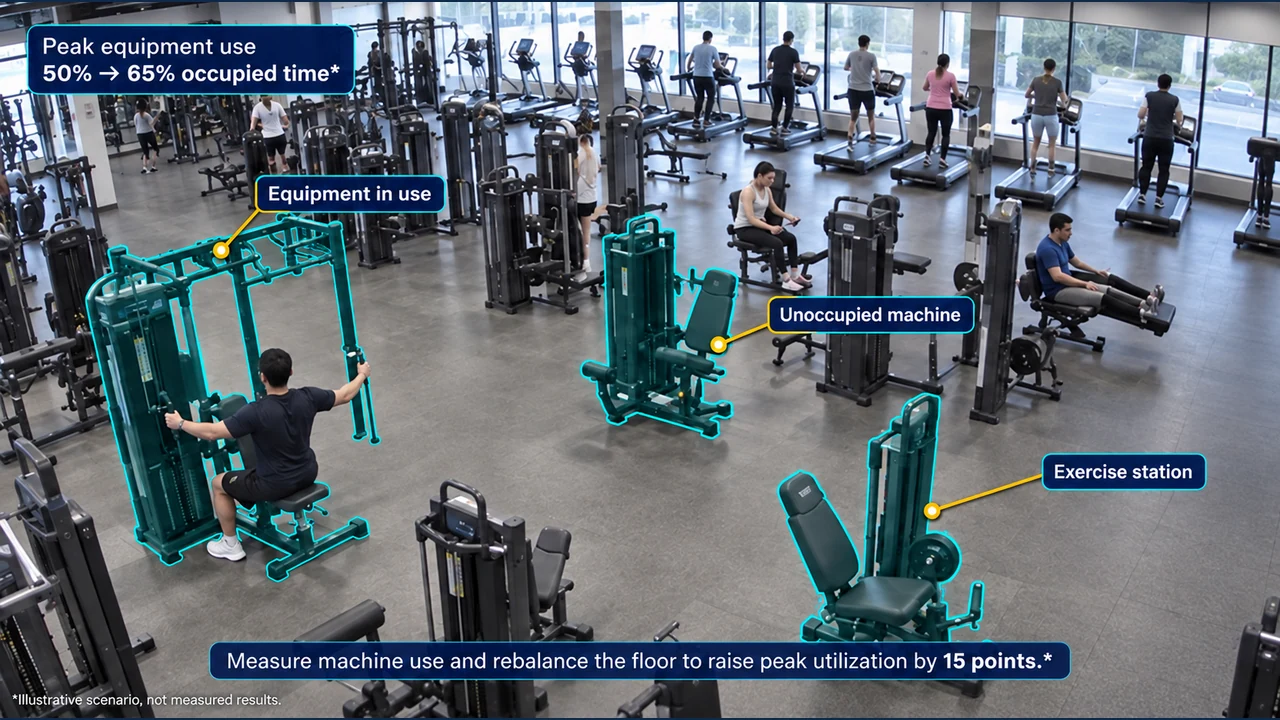
Equipment utilization
See recurring use, idle periods, and peak demand by machine—not just total club check-ins
Decision: rebalance the floor, justify additions, or retire equipment with low recurring demand
Illustrative target · 50% to 65% occupied timeMeasure machine use and rebalance the floor to raise peak utilization by 15 points.Illustrative scenario, not measured results. Outcomes require the stated target to be achieved and validated on site.
 View image at full size02
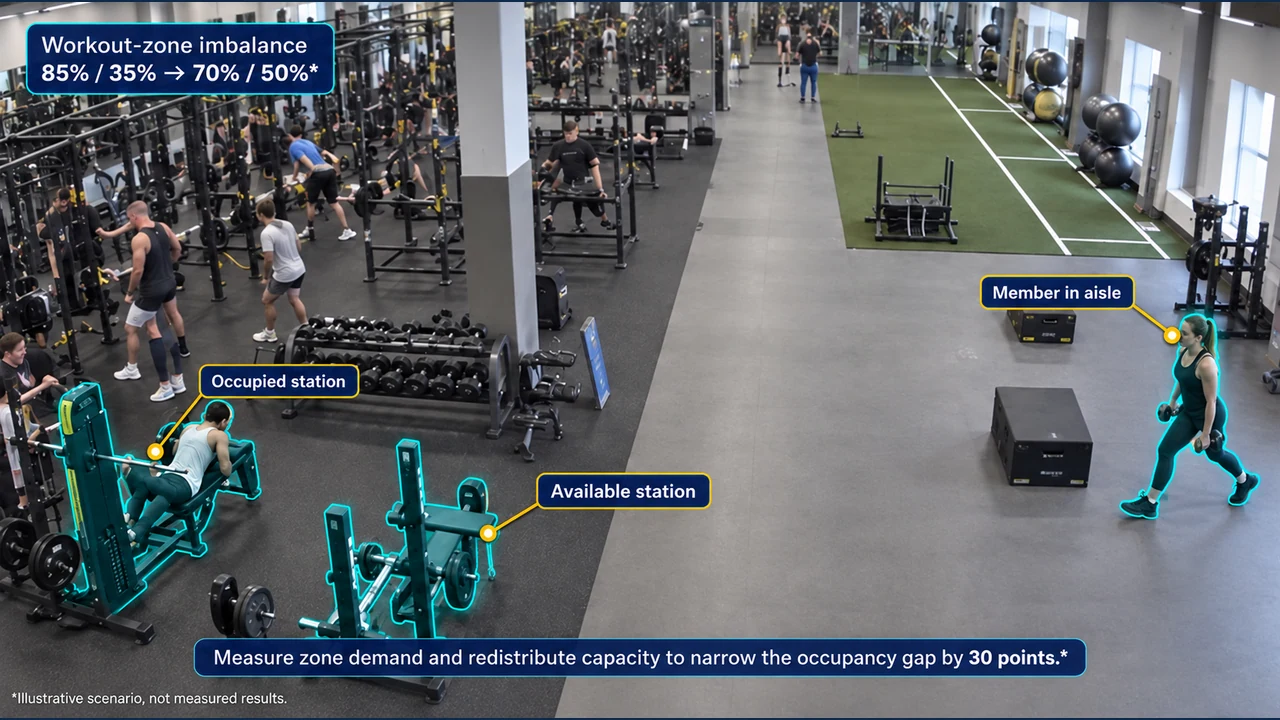
Space utilization
Compare demand and movement by workout zone and time to find crowded areas beside unused capacity
Decision: test a layout change against observed movement instead of a one-time walkthrough
Illustrative target · 85% / 35% to 70% / 50%Measure zone demand and redistribute capacity to narrow the occupancy gap by 30 points.Illustrative scenario, not measured results. Outcomes require the stated target to be achieved and validated on site.
 View image at full size03
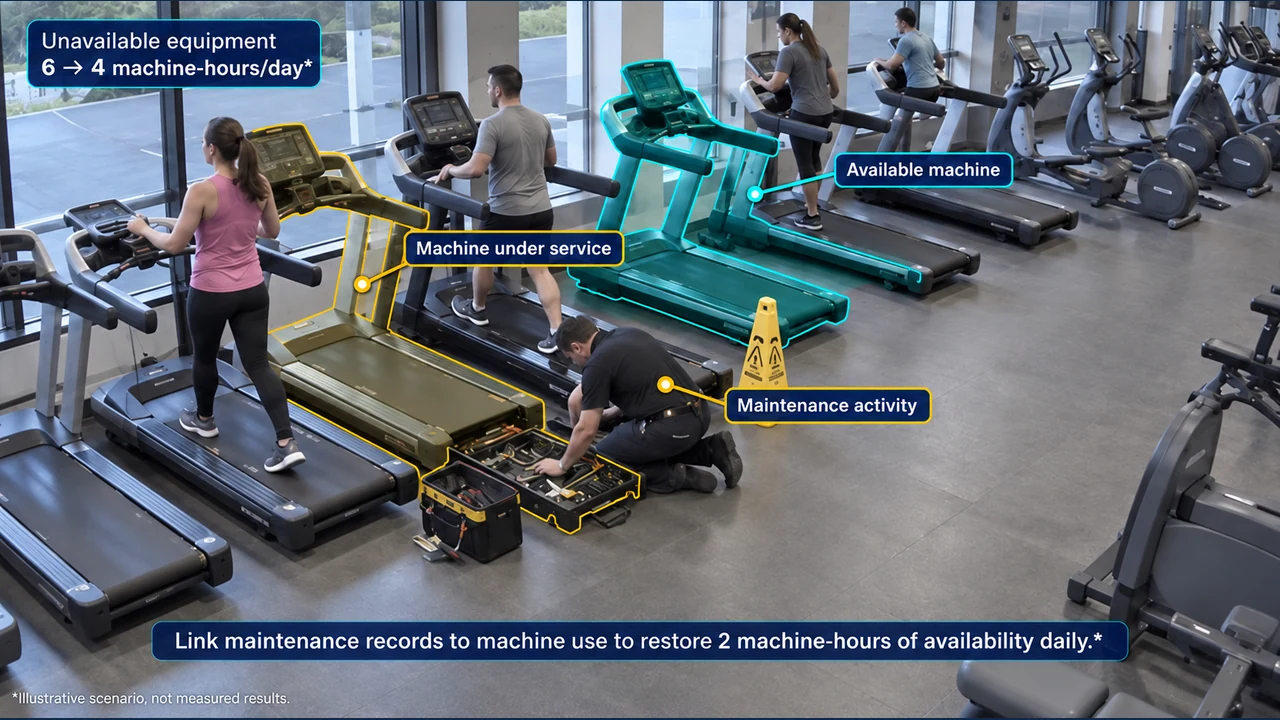
Equipment availability
Separate a machine that is simply idle from one that is unavailable because of faults, service, or repeated interruptions
Decision: prioritize maintenance by member impact, not only by the order a fault was reported
Illustrative target · 6 to 4 machine-hours/dayLink maintenance records to machine use to restore 2 machine-hours of availability daily.Illustrative scenario, not measured results. Outcomes require the stated target to be achieved and validated on site.
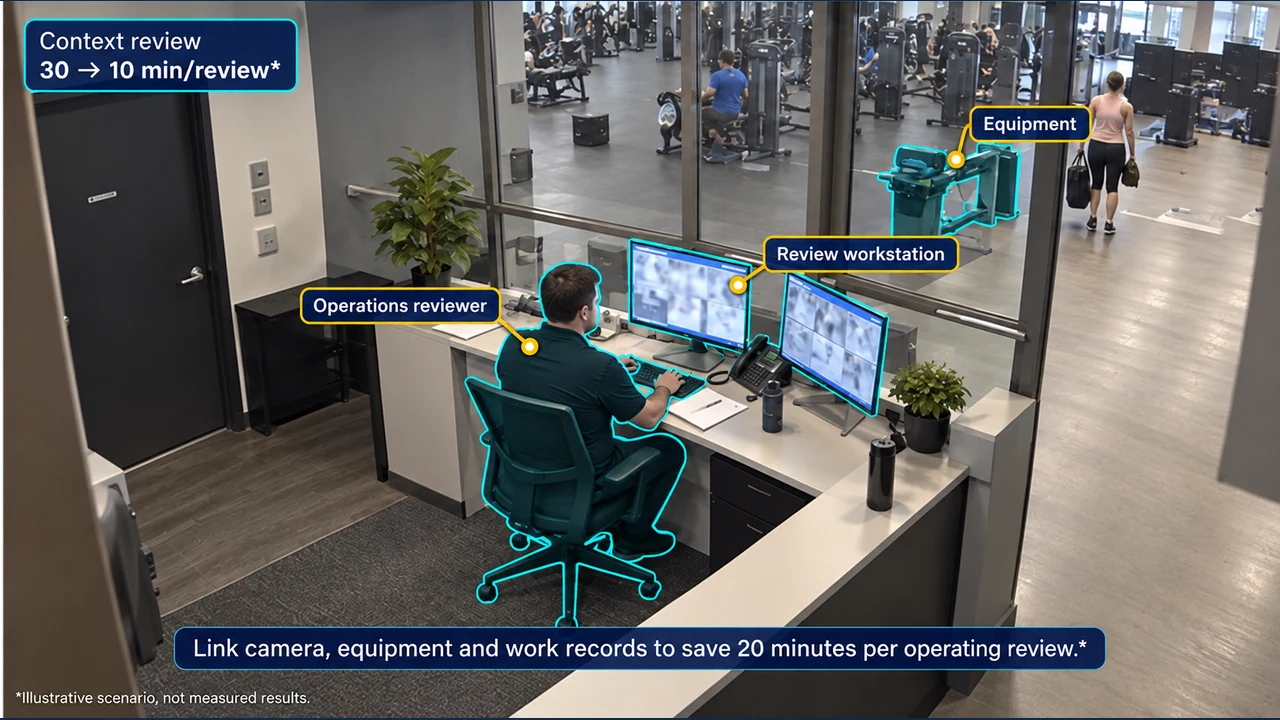 View image at full size04
Cross-source context
Place camera activity, radar events, machine telemetry, and work records on the same operating timeline
Decision: explain why utilization changed without asking teams to reconcile four separate dashboards
Illustrative target · 30 to 10 min/reviewLink camera, equipment and work records to save 20 minutes per operating review.Illustrative scenario, not measured results. Outcomes require the stated target to be achieved and validated on site.