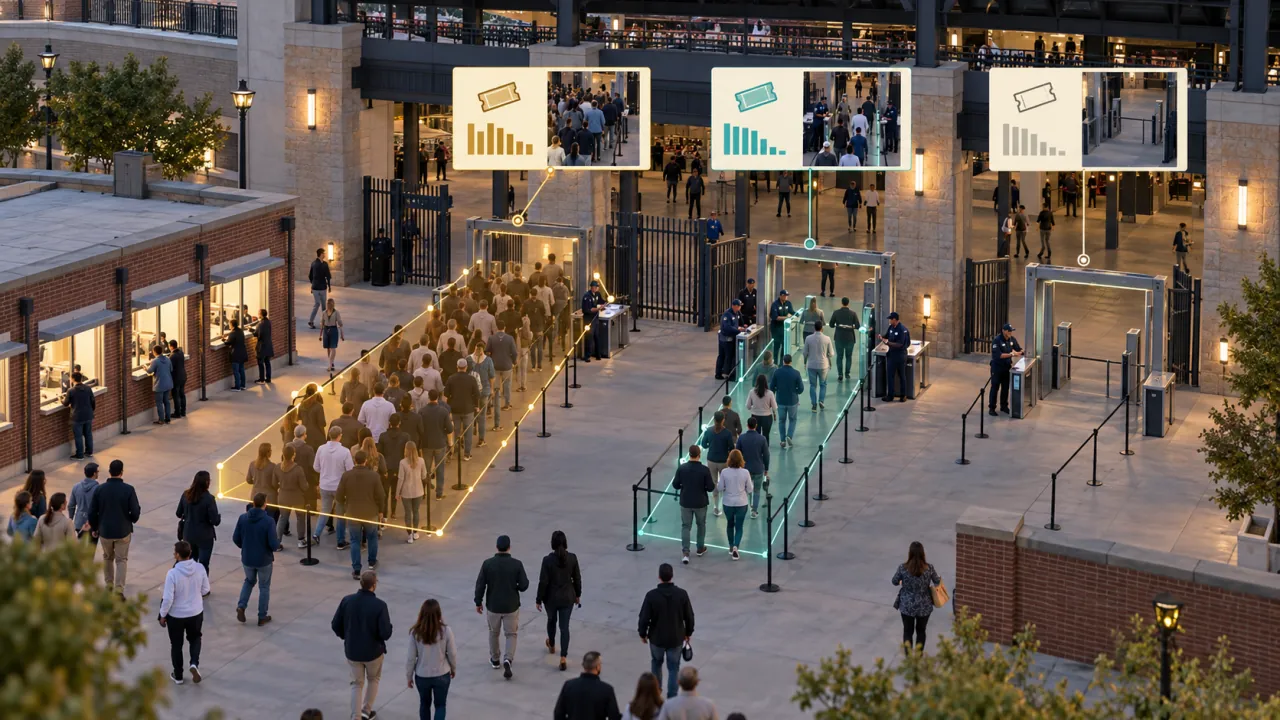
 01
Entrance throughput
Compare ticket scans, active lanes and actual gate flow by event phase.
Per-gate arrival volume and entrance throughput

Stadium crowd analytics
Entry surges and concession peaks occur at different event phases. See which gate, concourse or service point constrains the fan journey.
Applications
01Compare ticket scans, active lanes and actual gate flow by event phase.
Per-gate arrival volume and entrance throughput
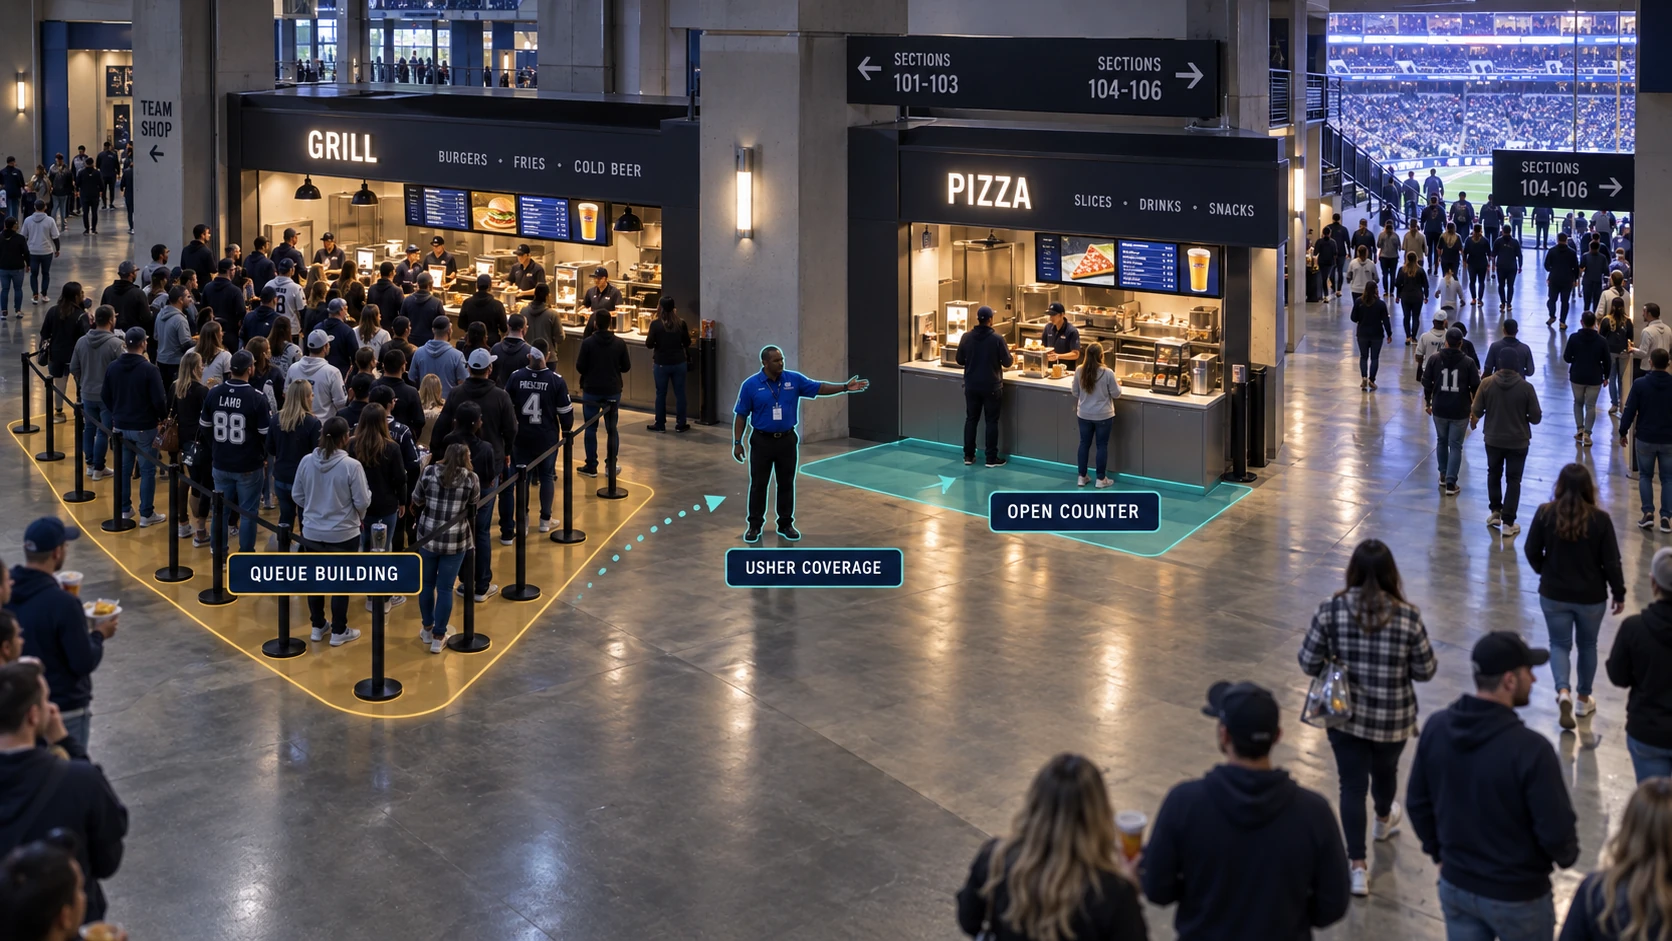 02
Connect POS demand, queue wait time and service starts at each concession.
Concession queue wait and service capacity
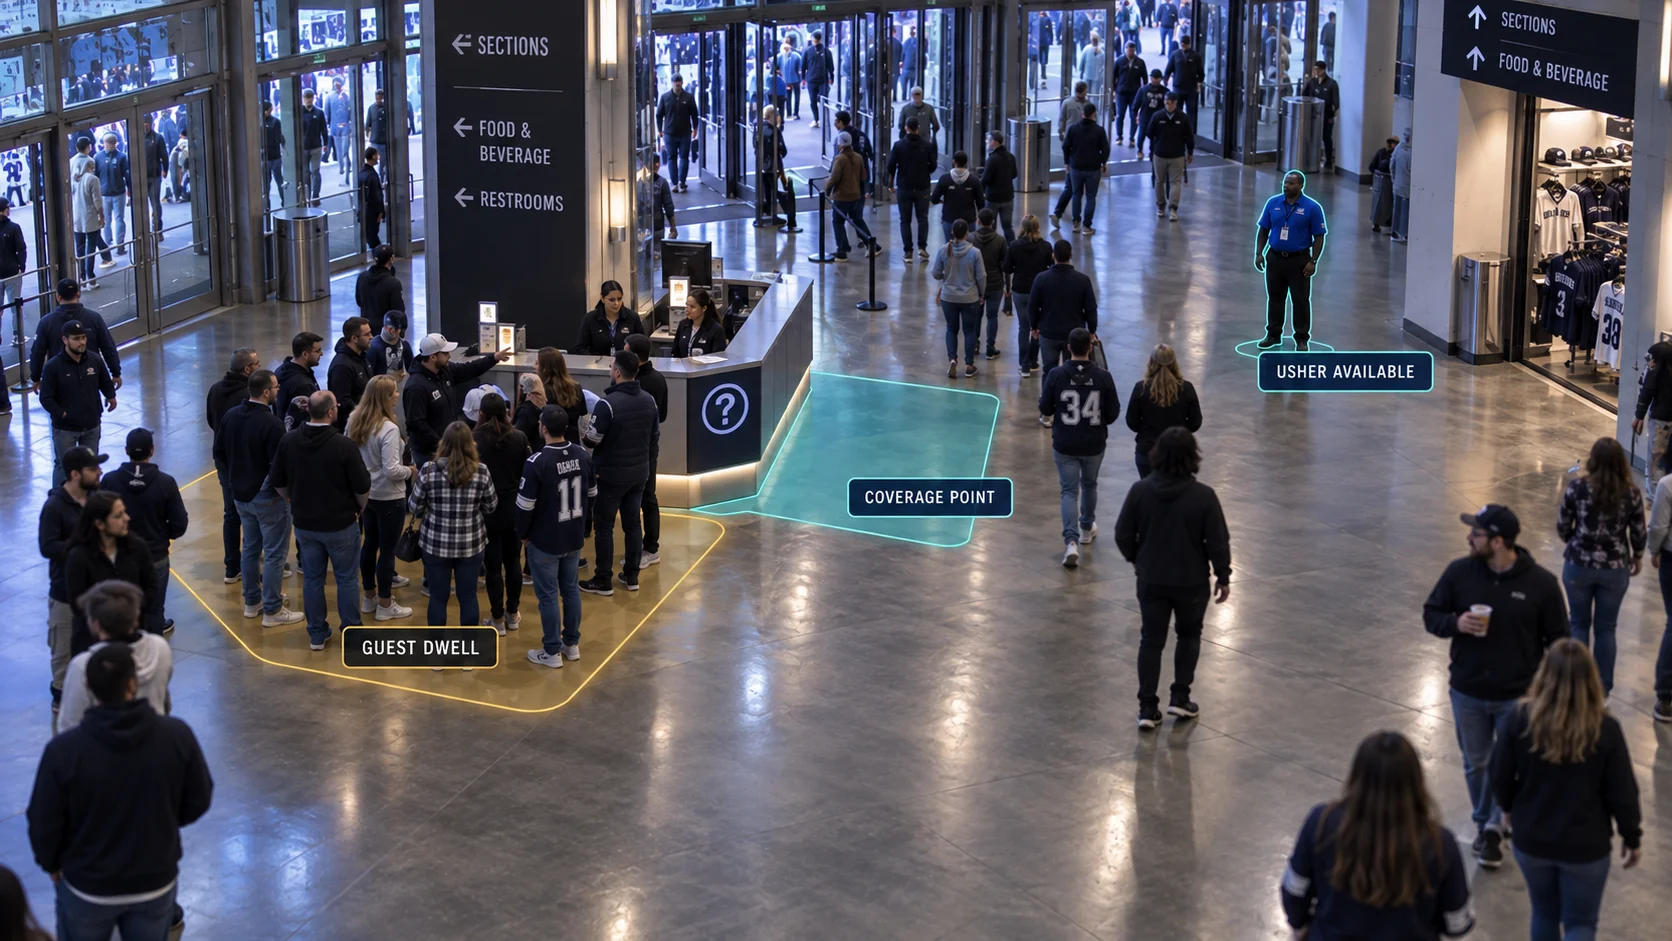 03
Review concourse demand and active service points to approve the next event's staffing plan.
Concourse density and essential-post coverage
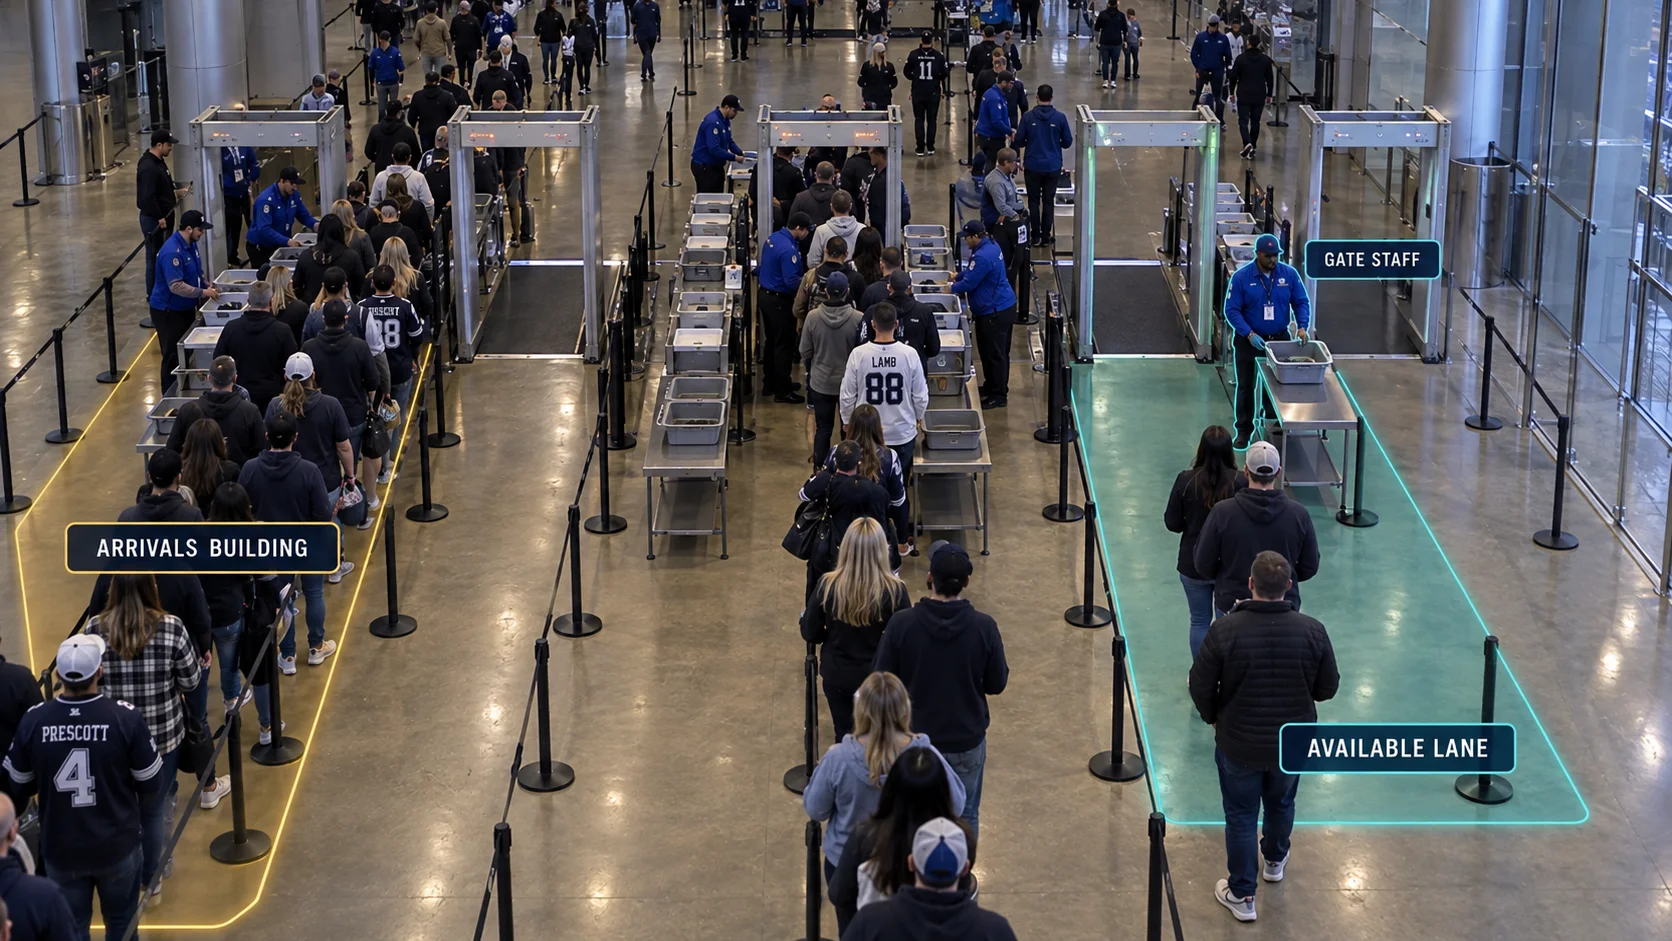 04
Compare gate and concession performance across equivalent event phases and attendance.
Waiting, circulation and service across event phases
Fortune AI
See your records, the relevant scene and an accountable next action in one review.