Follow each load through receiving and staging
Compare time at the dock, time in staging, and movement into storage to find which handoff needs review

3PL and distribution center analytics
Connect WMS and dock records with actual warehouse work to improve productivity, protect customer service and make consistent operating decisions across sites.
Request a demo
Start with the decision
Changing customer requirements, uneven workloads and repeated handoff delays raise cost-to-serve. Fortune AI connects labor, staging and dock capacity to fulfillment performance, helping teams prioritize improvements across the network.
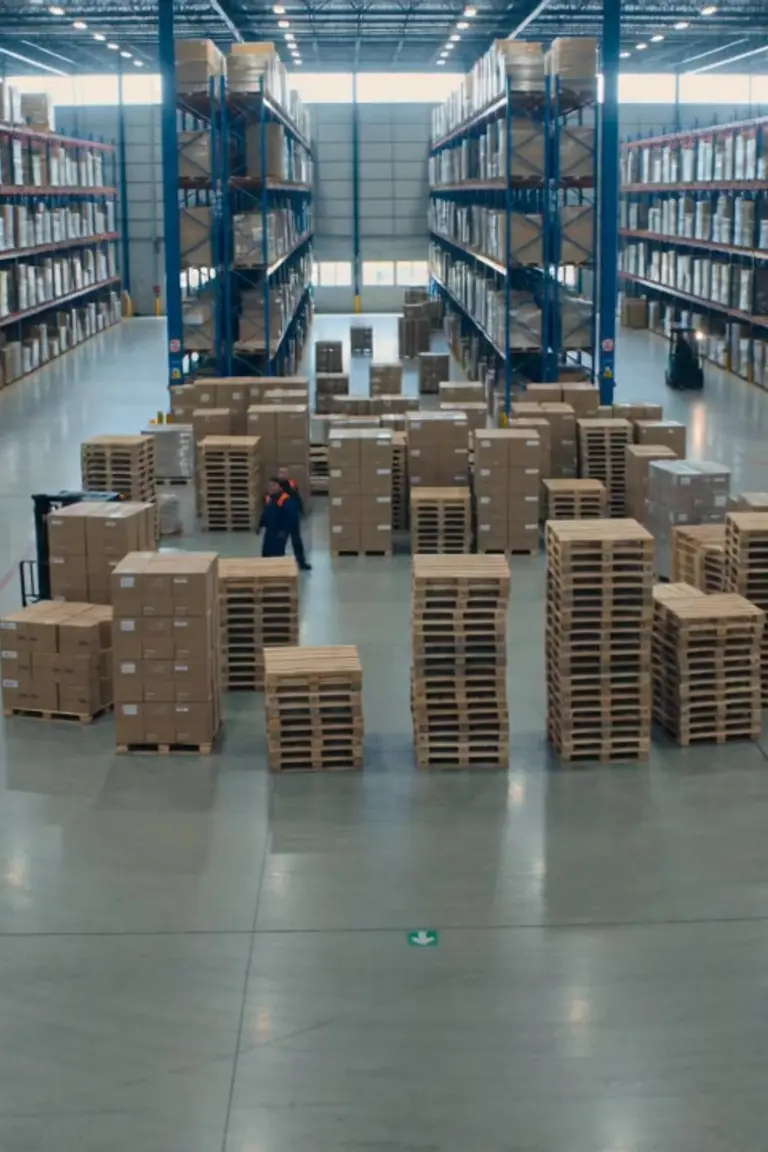
CAM 03 · INBOUND FLOOR
Loaded move matched
Live measurement
Match the same load from receiving through staging and put-away
Separate unloading, staging, travel, handling, and dwell
Compare delay by dock, zone, carrier, shift, and event with footage
Measurement live on existing cameras
Fortune AI platform
Prioritize put-away by waiting time. Review dock-to-stock time alongside the camera evidence for the same operating period.
Where do loads wait before put-away? The receiving handoff is the delay. Review the camera evidence, the measured dock-to-stock time, and the next action: prioritize put-away by waiting time.
Decision-ready output
Use the footage-backed result to adjust receiving coverage, staging space, dock schedules, or lane use
Receiving to putaway
Use operating evidence to improve productivity, cost control and service consistency.
Match WMS and dock records to actual warehouse work. Approve AI recommendations at a later review, then verify the change during the next comparable receiving shift.
 View image at full size01
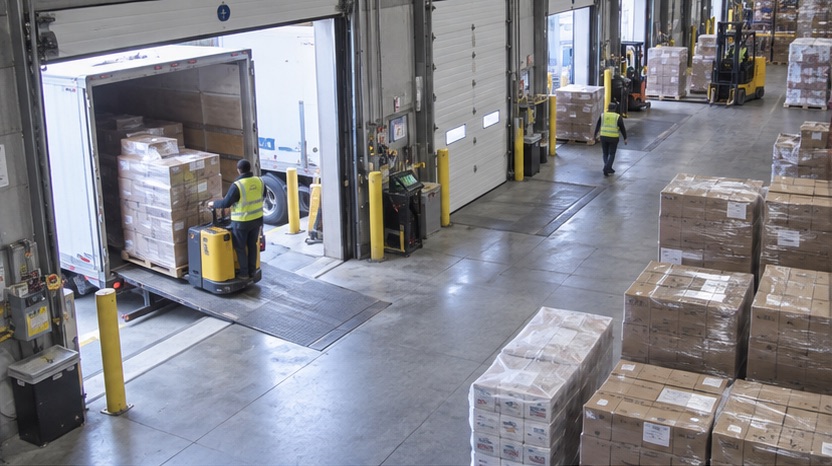
Time receiving, staging and putaway against WMS receipt and availability records.
Target the inbound handoff delaying available stock.
 View image at full size02
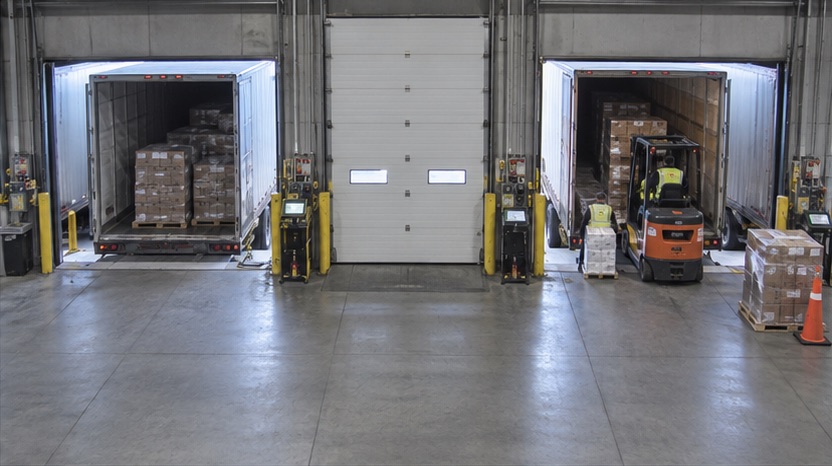
Compare trailer waiting, occupied dock time and idle doors with appointment records.
Review dock assignments and the next receiving schedule.
 View image at full size03
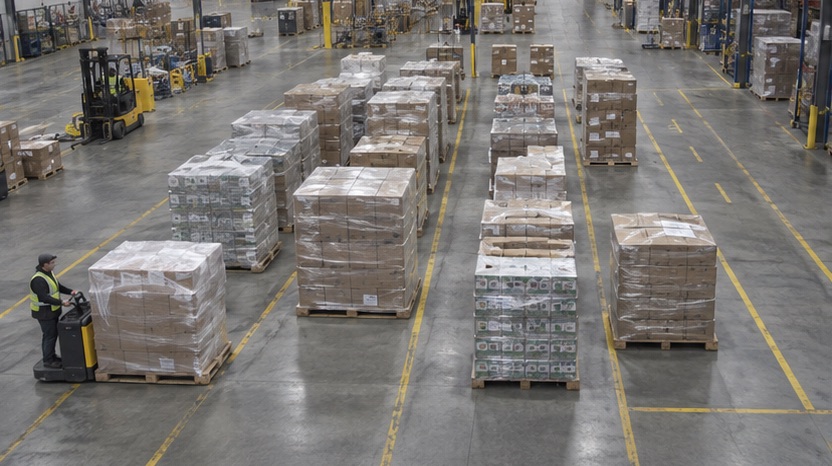
Measure pallet dwell and occupied lanes between receiving and putaway.
Recommend staging rules that keep the next transfer clear.
 View image at full size04
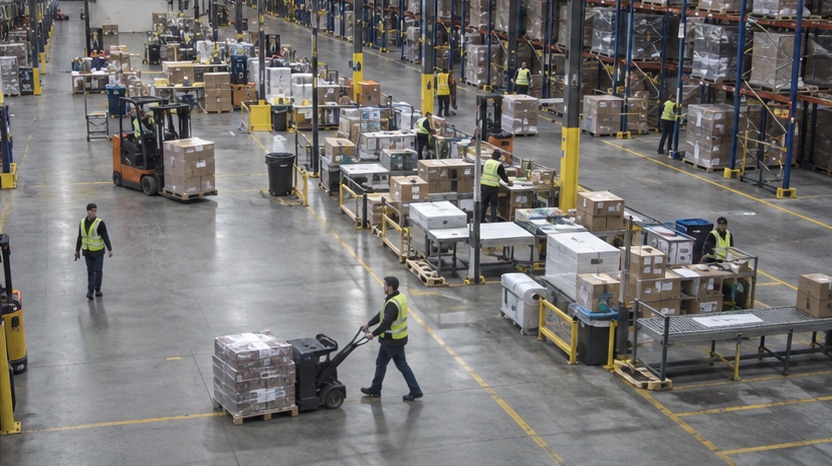
Separate handling, travel, waiting and gap time alongside completed WMS movements.
Verify output per labor hour after the change.
Start with the problem
Dock-to-stock guide
Separate unloading, receiving checks, staging, task release, travel, and putaway before changing labor or equipment. Review the broader warehouse bottleneck guide.
Start with one distribution decision
FAQ
Receiving stages, trailer dwell, staging capacity, and record integration.
Discuss your site's requirementsGeneral questions & other industriesConnect WMS and dock records with actual warehouse work to improve productivity, protect customer service and make consistent operating decisions across sites. AI recommends changes for a later operating review. The responsible lead approves the plan, then verifies results during the next comparable receiving shift.
What to measureOutput per labor-hour, order completion, dock-to-stock time and service consistency across comparable shifts.
Use WMS, labor and dock records as the basis for site comparisons. Connect each result to the relevant period and footage. Teams review the evidence, approve a change and verify service and productivity under comparable workloads.
What to measureSource records, matched periods, supporting footage and reviewed findings.
Scope the records, compatible camera views, connectors, training, costs and support responsibilities in one plan. Agree acceptance measures for productivity, cost control and service consistency, a named contact and the review process before expanding across operations.
What to measureAgreed scope, acceptance results, rollout costs and assigned follow-up.
Agree on the receiving, inspection, staging, and putaway observation points. Separate movement time from handoff waiting and review the supporting footage before changing operations. Customer, shipment, and appointment records require an agreed WMS or TMS integration.