 View image at full size01
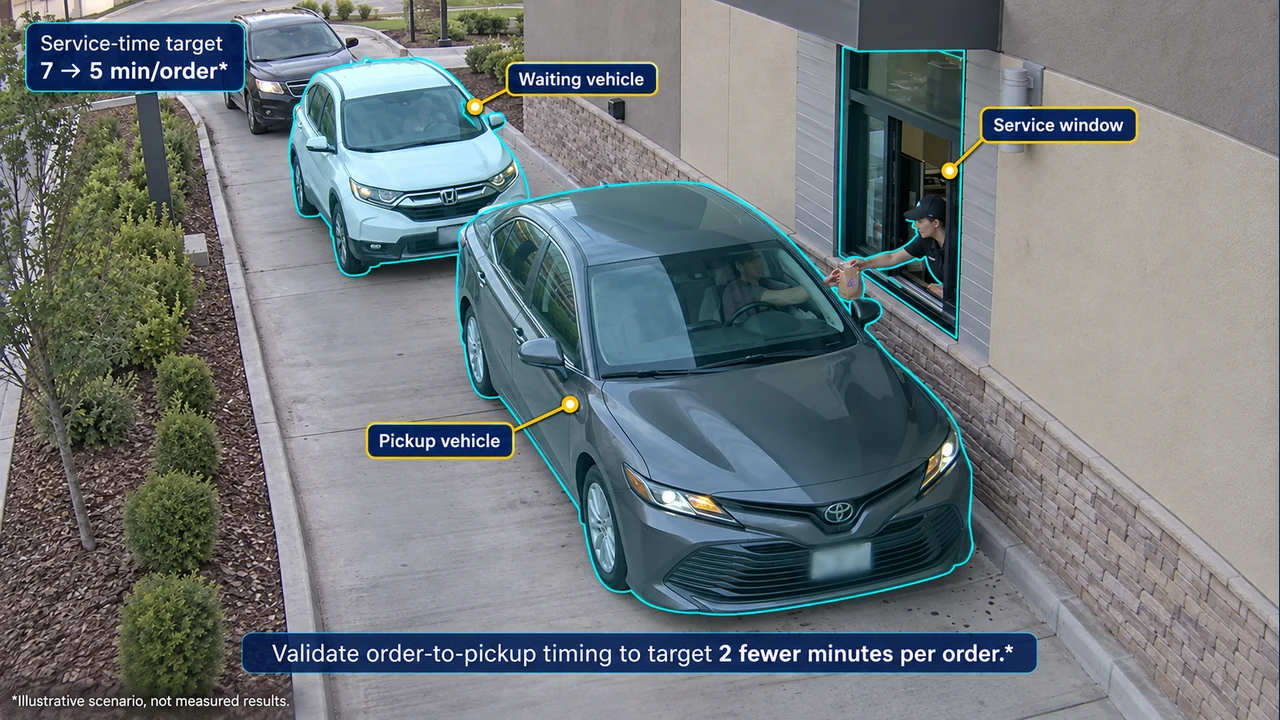
Speed of service
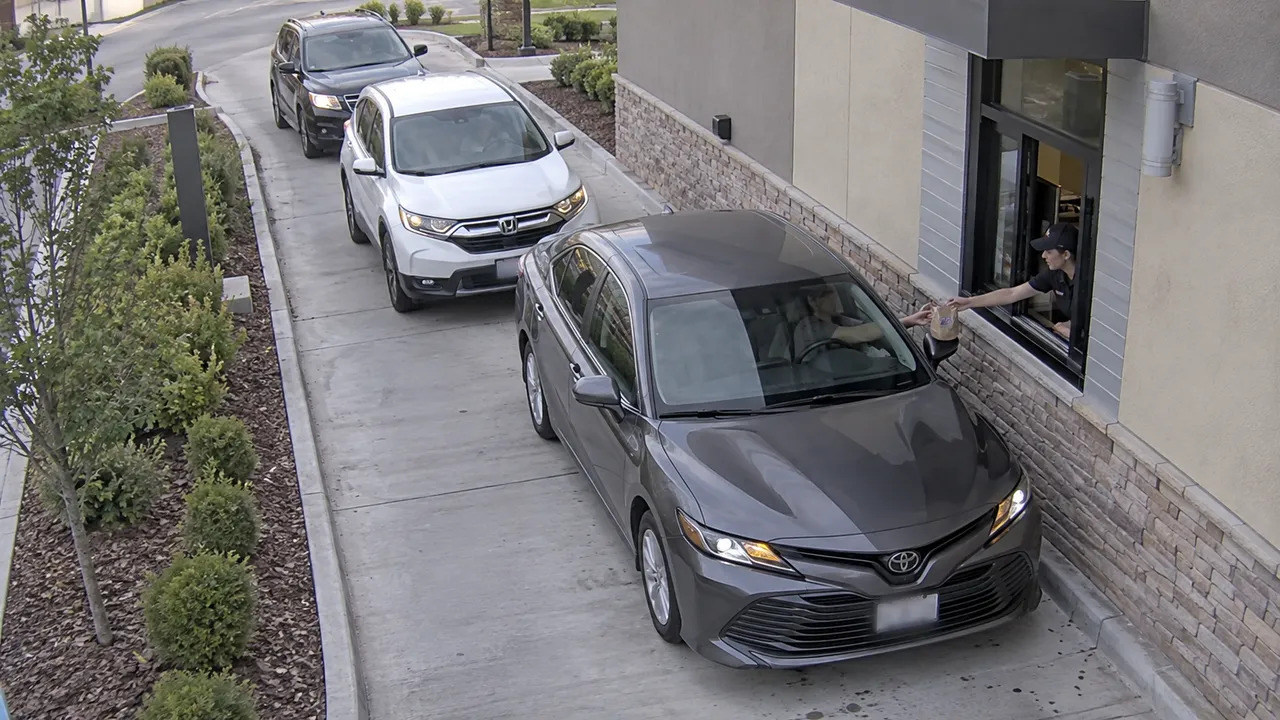
Explore time between an agreed order point and pickup endpoint.
Decision: Validate a consistent service-time definition.
Illustrative target · 7 to 5 min/orderValidate order-to-pickup timing to target 2 fewer minutes per order.Illustrative scenario, not measured results. Outcomes require the stated target to be achieved and validated on site.
 View image at full size02
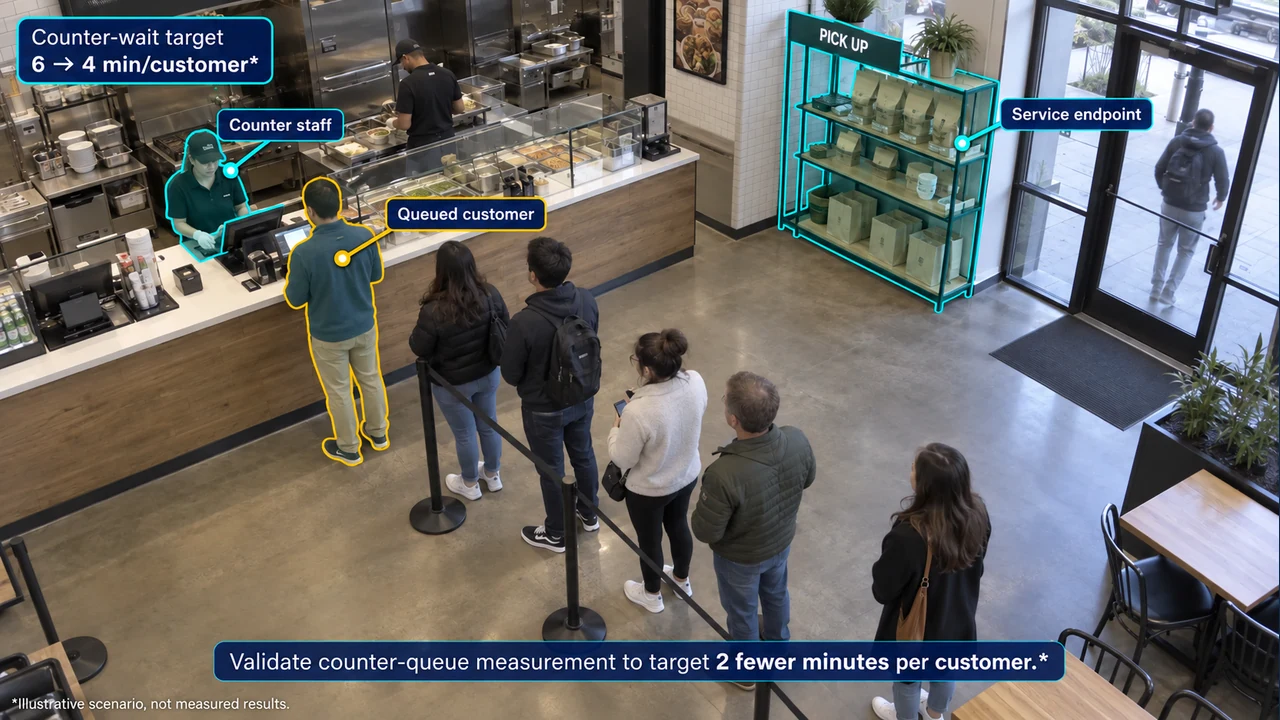
Counter queues
Explore visible queue size and waiting during peak service.
Decision: Review the mismatch between arrivals and service capacity.
Illustrative target · 6 to 4 min/customerValidate counter-queue measurement to target 2 fewer minutes per customer.Illustrative scenario, not measured results. Outcomes require the stated target to be achieved and validated on site.
 View image at full size03
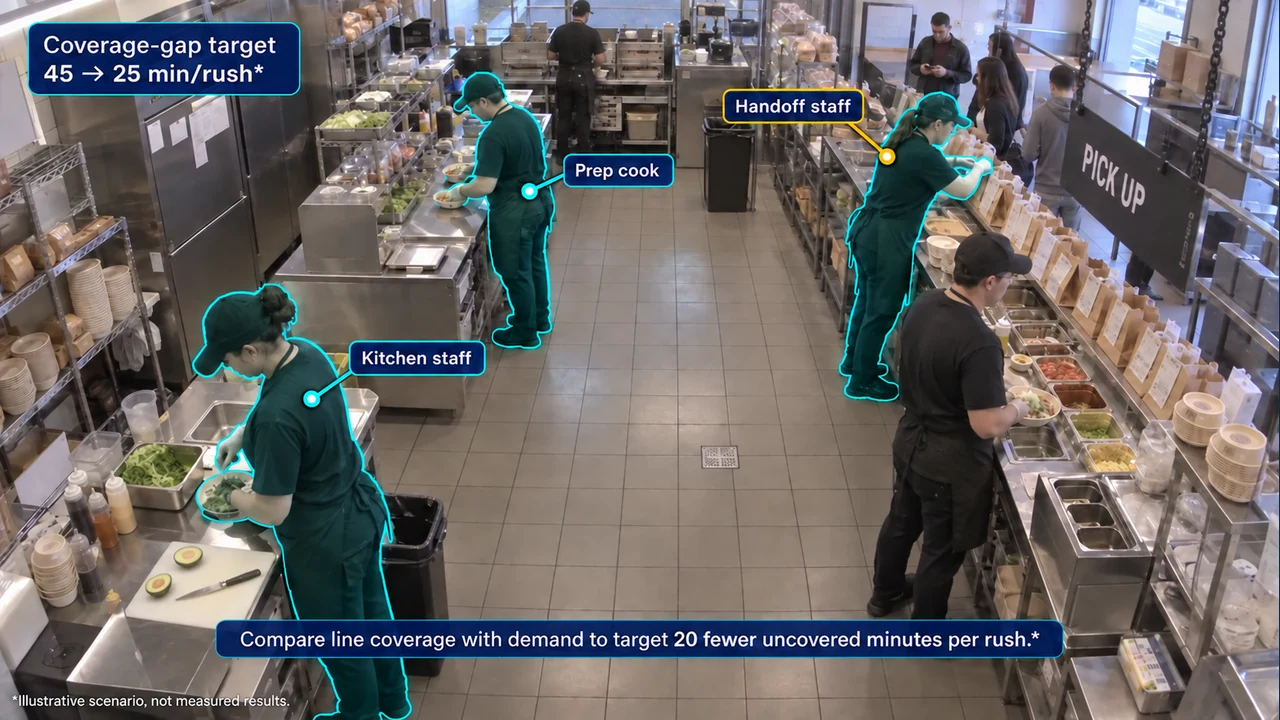
Labor against demand
Explore staff present on the line alongside tickets or arrivals when records are available.
Decision: Compare coverage with the actual rush.
Illustrative target · 45 to 25 min/rushCompare line coverage with demand to target 20 fewer uncovered minutes per rush.Illustrative scenario, not measured results. Outcomes require the stated target to be achieved and validated on site.
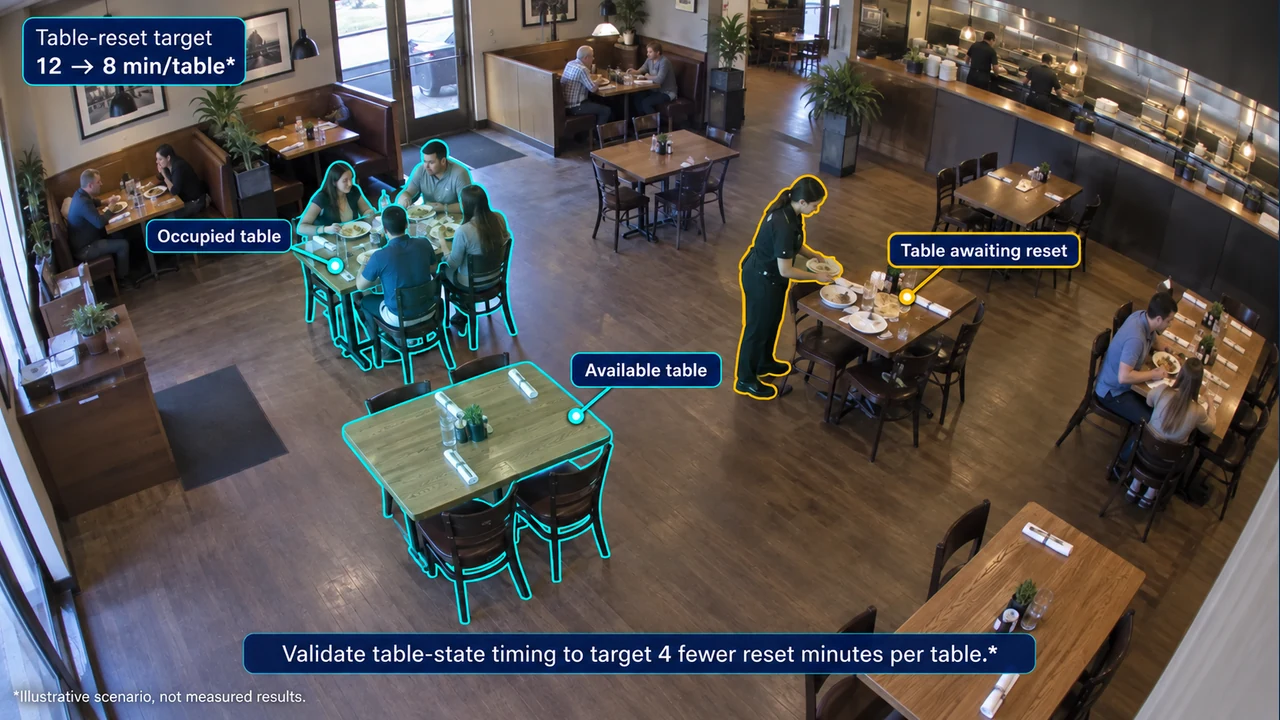 View image at full size04
Table occupancy
Explore occupied time and turnover in an agreed dining-area view.
Decision: Review how available capacity changes through service.
Illustrative target · 12 to 8 min/tableValidate table-state timing to target 4 fewer reset minutes per table.Illustrative scenario, not measured results. Outcomes require the stated target to be achieved and validated on site.